Soubor:Butterworth filter bode plot.svg

Popis
| Popis |
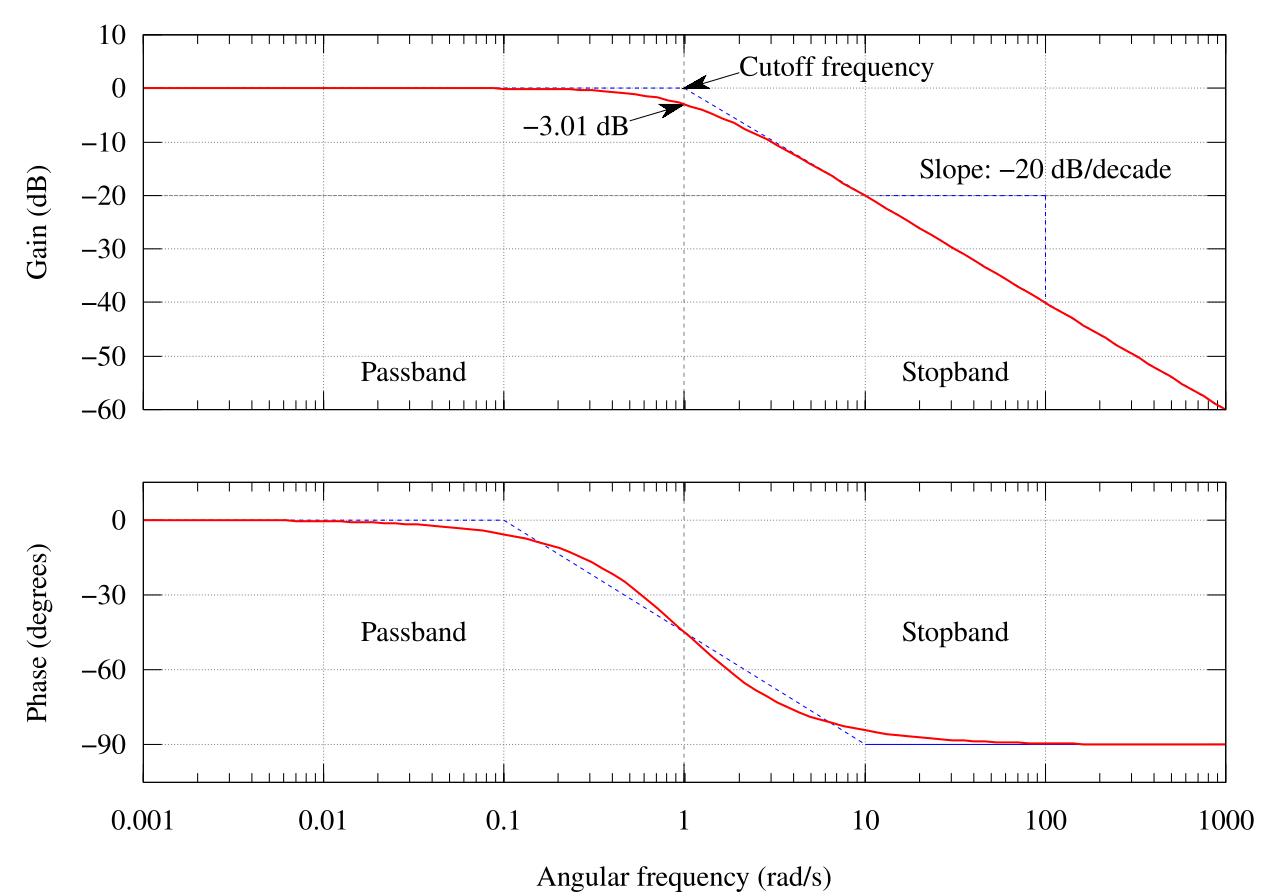
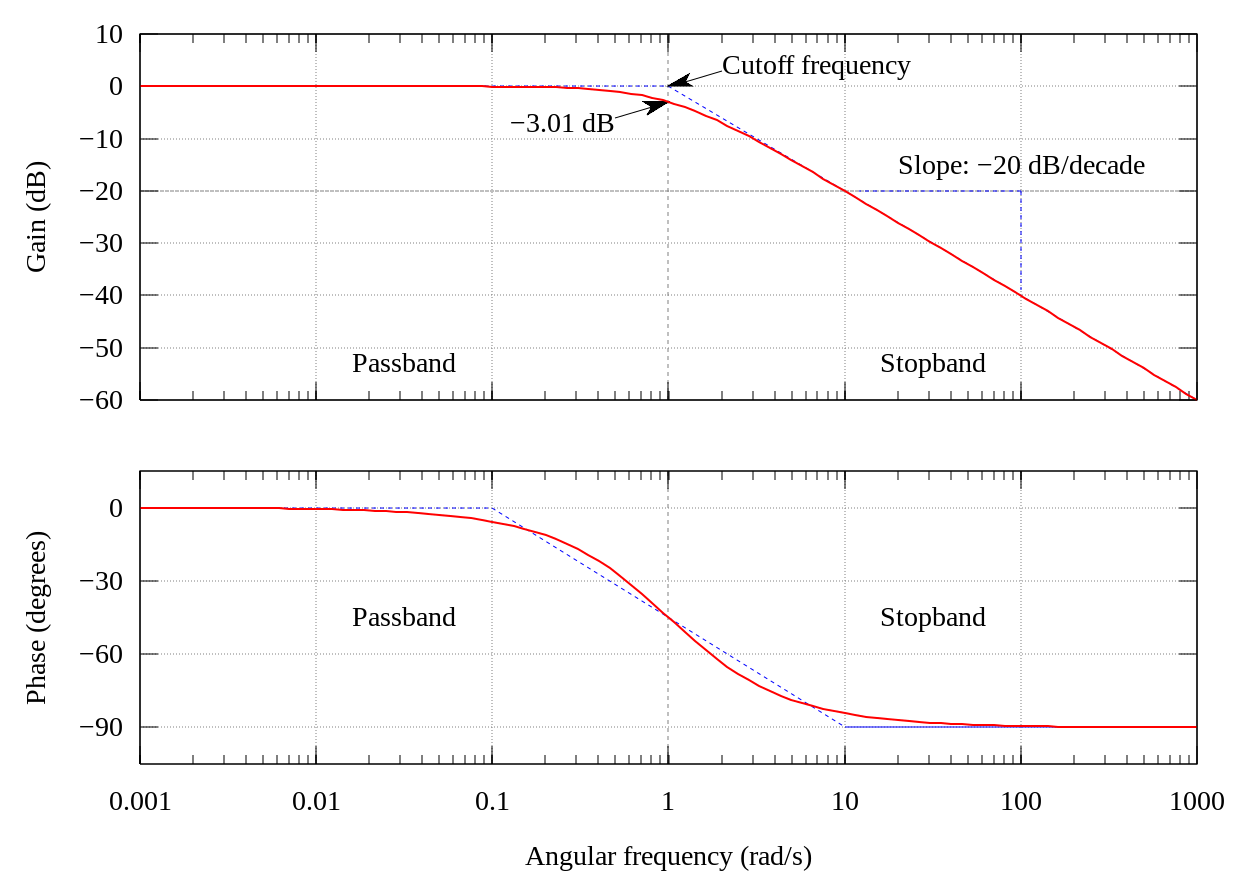
English: The Bode plot of a Butterworth filter with logarithmic axes and various labels. Cutoff frequency is normalized to 1 rad/s. Gain is normalized to 0 dB in the passband. Phase is in degrees because that's typical.
The code is kind of kludgy, but makes a good output. Generated in gnuplot with the script below (save as butterworth_bode_plot.plt and then open in gnuplot). Then it was postprocessed with Inkscape. See Wikipedia graph-making tips. Many orders on one plot: Image:Butterworth orders.png
Multilingual: angličtina; španělština; ruština |
||
| Datum | 26. dubna 2006 (upload date) | ||
| Zdroj | Vlastní dílo | ||
| Autor | Alejo2083 | ||
| Další verze |
[] .svg:
.png:
|
||
| gnuplot source | click to expand
set terminal svg enhanced size 1250 875 fname "Times" fsize 25
set output "Butterworth_filter_bode_plot.svg"

# Butterworth amplitude response and decibel calculation.  n is the order, which is just 1 in this image.
G(w,n) = 1 / (sqrt(1 + w**(2*n)))
dB(x) = 20 * log10(abs(x))
# Phase is for first order
P(w) = -atan(w)*180/pi


# Gridlines
set grid

# Set x axis to logarithmic scale
set logscale x 10

# No need for a key
set nokey #0.1,-25

# Frequency response's line plotting style
set style line 1 lt 1 lw 2

# Asymptote lines and slope lines are the same "arrow" style
set style line 3 lt 3 lw 1
set style arrow 3 nohead ls 3

# -3 dB arrow style
set style line 4 lt 4 lw 1
set style arrow 4 head filled size screen 0.02,15,45 ls 4

# Separator between passband and stopband line style
set style line 2 lt 2 lw 1
set style arrow 2 nohead ls 2


set multiplot

# Magnitude response
# =============================================
set size 1,0.5
set origin 0,0.5

# Set range of x and y axes
set xrange [0.001:1000]
set yrange [-60:10]

# Create x-axis tic marks once per decade (every multiple of 10)
set xtics 10
#set ytics 10

# No need for two sets of numbers
set format x ""

# Use 10 x-axis minor divisions per major division
set mxtics 10

# Axis labels
set ylabel "Gain (dB)"

# Draw asymptote lines
set arrow 1 from 1,0 to 1000,-60 as 3
set arrow 2 from .001,0 to 1,0 as 3

# -3 dB arrow
set arrow 4 from 2,3 to 1,0 as 4

# "Cutoff frequency" label uses same coordinates as the function
set label 3 "Cutoff frequency" at 2,4 l

# "-3 dB" label
set arrow 5 from 0.5,-6 to 1,-3 as 4
set label 4 "-3.01 dB" at 0.5,-7 r

# Draw a separator between passband and stopband and label them
set arrow 3 from 1,-60 to 1,10 as 2

# Label coordinates are relative to the graph window, not to the function, centered at the 1/4 and 3/4 width points
set label 1 "Passband" at graph 0.25, graph 0.1 c
set label 2 "Stopband" at graph 0.75, graph 0.1 c

# Draw slope lines and label
set arrow 6 from 100,-20 to 12,-20 as 3
set arrow 7 from 100,-20 to 100,-39 as 3
set label 5 "Slope: -20 dB/decade" at 100,-15 c

plot dB(G(x,1)) ls 1  title "1st-order response"


#Phase response
# =============================================
set size 1,0.5
set origin 0,0

# Set range of x and y axes
set yrange [-105:15]

# Create y-axis tic marks every 15 degrees
set ytics 30

# Regular numbers
set format x "% g"

# Axis labels
set ylabel "Phase (degrees)"
set xlabel "Angular frequency (rad/s)"

# Draw asymptote lines
set arrow 1 from 0.1,0 to 10,-90 as 3
set arrow 2 from 0.001,0 to 0.1,0 as 3
set arrow 10 from 10,-90 to 1000,-90 as 3

# -3 dB arrow
unset arrow 4 #from 2,3 to 1,0 as 4

# "Cutoff frequency" label uses same coordinates as the function
unset label 3 #"Cutoff frequency" at 2,4 l

# "-3 dB" label
unset arrow 5 #from 0.5,-6 to 1,-3 as 4
unset label 4 #"-3.01 dB" at 0.5,-7 r

# Draw a separator between passband and stopband and label them
set arrow 3 from 1,-105 to 1,15 as 2

# Label coordinates are relative to the graph window, not to the function, centered at the 1/4 and 3/4 width points
set label 1 "Passband" at graph 0.25, graph 0.5 c
set label 2 "Stopband" at graph 0.75, graph 0.5 c

# Draw slope lines and label
unset arrow 6 #from 100,-20 to 12,-20 as 3
unset arrow 7 #from 100,-20 to 100,-39 as 3
unset label 5 #"Slope: -20 dB/decade" at 100,-18 c

plot P(x) ls 1 title "Phase response"


unset multiplot
|


|
Je k dispozici  . .Pokud je lepší, používejte raději tu. File:Butterworth filter bode plot.svg → File:Butterworth filter bode plot.png
Více informací o rastrové a vektorové grafice najdete na stránce Commons:Transition to SVG. Také si můžete přečíst informace o podpoře SVG v Mediawiki. |
|
Licence

|
Tento dokument smí být kopírován, šířen nebo upravován podle podmínek Svobodné licence GNU pro dokumenty verze 1.2 nebo libovolné vyšší verze publikované nadací Free Software Foundation. Dokument nemá neměnné části ani texty na předním či zadním přebalu. Kopie textu licence je k dispozici v oddíle nazvaném GNU Free Documentation License. |
| Tento soubor podléhá licenci Creative Commons Uveďte autora-Zachovejte licenci 3.0 Unported. | ||
| ||
| Tato licenční šablona byla k tomuto souboru přidána v rámci změny licencování. |
- Dílo smíte:
- šířit – kopírovat, distribuovat a sdělovat veřejnosti
- upravovat – pozměňovat, doplňovat, využívat celé nebo částečně v jiných dílech
- Za těchto podmínek:
- uveďte autora – Máte povinnost uvést autorství, poskytnout odkaz na licenci a uvést, pokud jste provedli změny. Toho můžete docílit jakýmkoli rozumným způsobem, avšak ne způsobem naznačujícím, že by poskytovatel licence schvaloval nebo podporoval vás nebo vaše užití díla.
- zachovejte licenci – Pokud tento materiál jakkoliv upravíte, přepracujete nebo použijete ve svém díle, musíte své příspěvky šířit pod stejnou nebo slučitelnou licencí jako originál.
Historie souboru
Kliknutím na datum a čas se zobrazí tehdejší verze souboru.
| Datum a čas | Náhled | Rozměry | Uživatel | Komentář | |
|---|---|---|---|---|---|
| současná | 12. 10. 2023, 03:39 | | 1 250 × 875 (31 KB) | wikimediacommons>Mikhail Ryazanov | +ru translation |
Využití souboru
Tento soubor používá následující stránka: